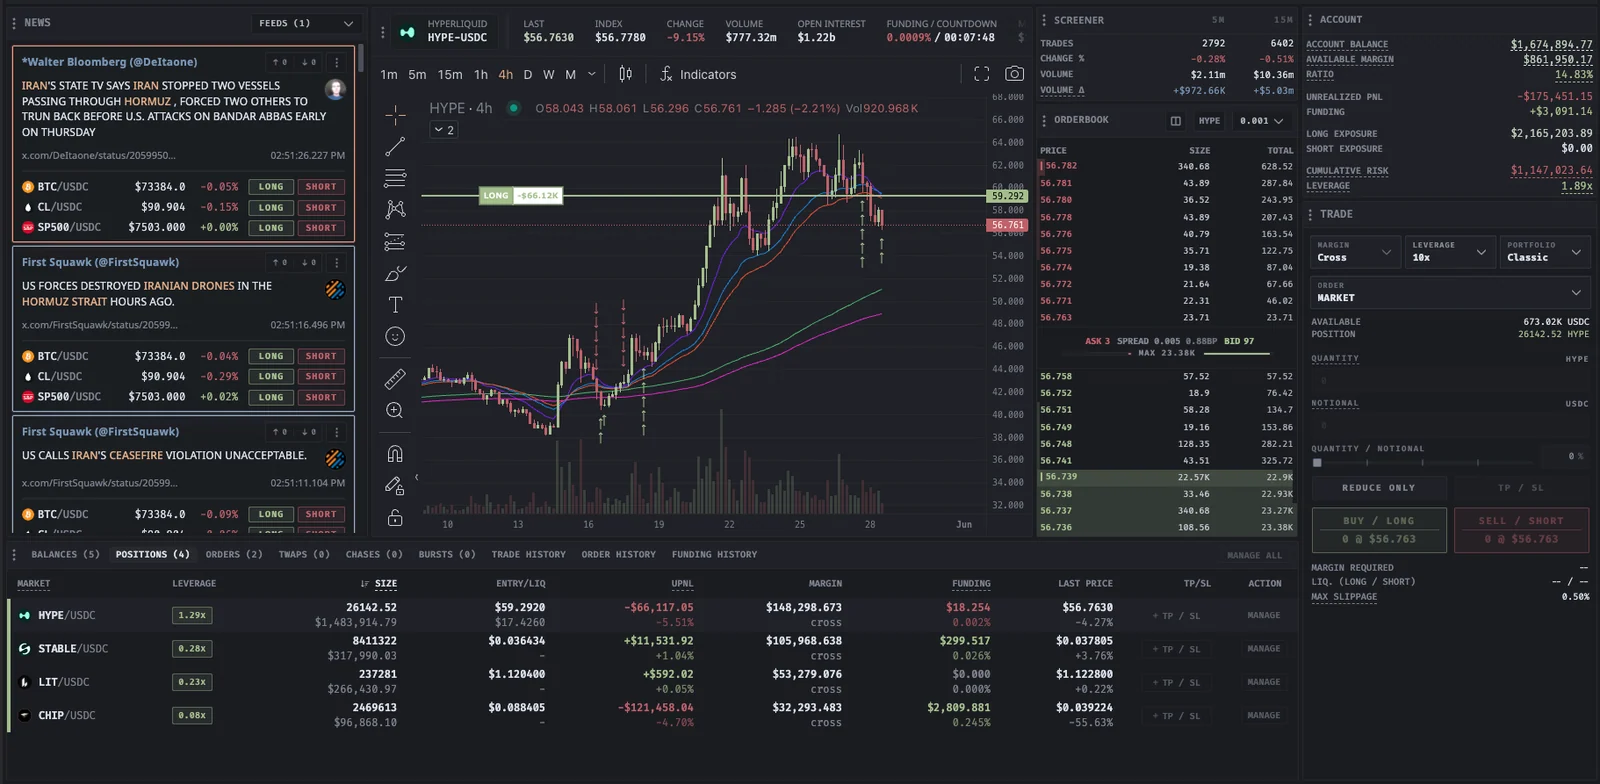
Forced-flow market context

Hyperliquid liquidation tracker and risk map

Proliquid maps public Hyperliquid liquidation zones and large at-risk positions for a selected market, helping you inspect where forced selling or forced buying could appear if price reaches a risk area.

Traders searching for a Hyperliquid liquidation heatmap are usually trying to locate concentrated leverage risk. Proliquid provides a public-position risk map that is most useful beside trend, support and resistance, funding, whale activity, and orderbook liquidity. A visible cluster is a scenario to monitor, not a guaranteed price target.

Free to explore · Connect a wallet only when you are ready to trade

  • Hyperliquid liquidation map by market
  • Large public positions near estimated risk levels
  • Cross-checks for chart, whales, funding, and depth

Map the pressure

See where leverage may become forced flow.

Liquidations can accelerate an existing move, but the path and timing depend on price, margin changes, closing activity, and available liquidity.

Clusters

Long and short liquidation map

Group estimated liquidation exposure around price areas to compare potential forced selling below market with potential forced buying above market.

ValidateMeasure distance from current price and compare each zone with chart structure.

Size

Large at-risk positions

Inspect public addresses and positions with meaningful exposure near estimated liquidation levels for the selected Hyperliquid market.

ValidateRe-check the position because traders can add margin, reduce size, or close before the level is reached.

Direction

Forced-flow scenarios

Long liquidations can add sell pressure during a decline, while short liquidations can add buy pressure during a rise.

ValidateConfirm that price is moving toward the zone and that broader market activity supports the scenario.

Context

Connected market checks

Open the market in Terminal and compare liquidation zones with the chart, orderbook, whale feed, funding, and recent news.

ValidateLook for independent agreement and define what invalidates the setup before selecting an order.

Liquidation-level workflow

Plan around pressure without treating it as certainty.

Use liquidation data to frame conditional scenarios. Ask what could happen if price reaches a zone, and what must be true before you act.

Read the product guide
  1. Choose a liquid market

    Select the exact Hyperliquid market and confirm it has enough recent volume and orderbook depth for the size you are considering.

  2. Compare zones around price

    Identify clusters above and below, their relative exposure, distance from current price, and alignment with support or resistance.

  3. Cross-check the pressure

    Review funding, whale activity, news, trend, and visible liquidity to see whether the market is becoming vulnerable to acceleration.

  4. Define a conditional plan

    Set the trigger, invalidation, order type, slippage or limit controls, leverage, and monitoring plan before price reaches the area.

Data limitations

Liquidation levels move when positions move.

The underlying public position state is not fixed. The tracker should be re-checked as price changes and before using an older level in a current plan.

Estimation and refresh risk

The view refreshes automatically on an interval, and estimates can become stale between updates as accounts change margin or exposure.

No guaranteed magnet

Price does not have to visit a liquidation cluster. Traders can close, hedge, or add collateral before the estimated level.

Cascade execution risk

Spread and slippage can expand during forced-flow events. Visible liquidity may disappear precisely when a level begins to matter.

Before you trade

Questions about this workflow

Product behavior and limits, explained without trading promises.

What does the Proliquid crypto liquidations tracker show?

It shows public Hyperliquid liquidation zones, large at-risk positions, and directional forced-flow context for a selected market. This provides the risk-map context traders often seek in a Hyperliquid liquidation heatmap, but it does not predict where price will go or capture every possible liquidation.

How often does Hyperliquid liquidation data refresh?

The Liquidations view refreshes automatically every 15 minutes. Positions can change between refreshes, so re-check the view before trading around an older level.

Are liquidation clusters guaranteed price targets?

No. Traders can add margin, reduce exposure, hedge, or close before liquidation. Price may also reverse before reaching a cluster.

What should I compare with liquidation levels?

Compare them with current price, trend, support and resistance, orderbook depth, funding, whale activity, news, and your own predefined invalidation and risk limits.

Plan the pressure

Map liquidation zones while the tape is still calm.

Inspect both sides of the market, validate the live context, and carry a defined scenario into the Hyperliquid terminal.